Category Archives: infographics

Credit Card Facts and Risks for College Students


It is easy to be lured in getting a credit card when you are in college. This is due to the expenses that you need to pay and the limited amount of money that you have.

Getting a credit card won’t be a problem if you know you are able to repay what you have borrowed. If you have a part-time job, go ahead and get one. Without an income source however, getting a credit card would be very risky.

Aside from the risk of not being able to pay your debts, you also place yourself at risk of a possible credit card fraud. A lot of naïve college students have fallen victim to credit card scammers. These are people who will do everything just to take your money away from you.

They have employed different strategies aimed at fooling people to provide their credit card information or online account passwords so they can make use of the credit card as their own. You can only imagine how devastating it would be if you are a victim of this scam.

If adults who have full time jobs have a hard time facing this kind of problem, you don’t want to imagine what could happen to you considering that you don’t even have a job. This is why you really have to stay protected. With the right knowledge on how to fight against these scammers, it is easy to stay away from them.

Below is an infographic giving you more information about credit card fraud. It also provides tips on how you can keep yourself protected against these bad people. You need to do everything so they won’t lure you into their scams and eventually report them to the authorities.

Credit Card Fraud Stats - Protect Yourself from Being Scammed

Infographic: How College Rankings Work


College rankings are important to millions of incoming students a year, yet few actually know how the rankings are compiled. To give viewers a more clear look at what’s involved with compiling college rankings at the top rankings organizations, the editors at College Choice have created this graphic to explain methodologies.


How College Rankings Work
Source: CollegeChoice.net

A Financial Aid Flowchart


Financial aid can be confusing for parents and students. From scholarships, to loans, to 529 funding, it can be an overwhelming process.

Student financial aid comes in all shapes and sizes – and one size doesn’t fit all when it comes to paying for college. With many different student loans to choose from, finding the optimal path to college funding can be tricky. eStudent Loans created this graphic to help those who need more than just scholarships and grants to fund their education and fund it in a way that will help save you money.

So, if you’re one of the thousands of students that are not sure where to start, relax. Simply use their financial aid flowchart to help you explore nearly every possible option available to help you cover the costs of earning your college degree. At the same time, they also show you the order in which you should pursue each funding source.

Financial Aid Flowchart: A Guide for Students Paying for College by eStudentLoan

Financial Aid Flowchart: A Guide for Students Paying for College from eStudentLoan

Download the interactive Financial Aid Flowchart

Creative Ways to Fund Your Education


If you’ve been to college, are in college or are planning to go, you know that a college degree can cost enough to affect your personal finances for years – sometimes for life. We look at some facts and figures about college, tuition, and some of the ways that students pay for their degree.

Funding College: The Numbers

There are three timelines for raising funds to pay for college tuition: before, during and after. Obviously, having some or all funds upfront is nice. It gives you a 3-4 year head start on students who accumulate college debt. But given the cost of college, it’s not an option for everyone. Earning and paying tuition during college costs you time while you’re studying, potentially delaying your degree with distractions — but it’s a fact of life. Paying for college after graduating — i.e., acquiring student debt — is of course the most costly option because it involves interest payments. Of course, if you drop out of college and have loans, those could come due immediately.

BestCollegesOnline.org takes a look at the numbers for college enrollments, tuition and other related figures to give you creative ways to fund your education. Click on the image to see the complete infographic.

fund your education


Scholarships Demystified


Everyone knows that students in America love scholarships. Each year, millions of students apply for financial aid as they prepare for college in the hopes of easing the financial pain of rising tuition costs. But did you know just how much money was being dished out every year? Or where that money came from?

FluidReview, a company that specializes in scholarship management systems, has put together this infographic that demystifies the topic of scholarships in America. Some of this information might surprise you. Click on the excerpt below and it will take you to the complete infographic.

scholarships demystified

How Much Do College Students Drink?


There are 17 million college students that drink alcohol, and 8.5 million of them are binge drinking. We’ve heard the terms “poor” or “struggling” college student before, but it’s no wonder they are living off of Ramen Noodles when there was a reported $163 billion spent on alcohol in America in 2011. It’s not all fun and games when young people are consuming 2 gallons per person of alcohol. There are negative consequences of this behavior that includes assault, rape, injury and even death.

How much do college students drink? It seems that students are learning a lot more than econ and statistics nowadays. Click on the infographic below to see all the data.

college drinking

College isn’t cheap (an infographic)


There’s no denying that college is outrageously expensive. And, unfortunately, it is only getting worse; while the average family income in the United States grew 147% in the years between 1982 and 2007, the cost of college grew by a staggering 440% in that same period. What that means in terms of real numbers is that the average cost of a four-year degree from a state school is now $30,000. Most American families do not have that kind of money up front, which necessitates that they borrow it from private or government programs that issue student loans. Unfortunately, student loans leave college graduates an average of $20,000 in debt when they finish school. And approximately 10% of graduates will have twice that debt to repay. Collectively, American students owe more than one trillion dollars.

Figures like these, in combination with the fact that only half of all college graduate obtained a full-time job in 2011, are why more than six million graduates cannot pay back their student loans. The economic recession that began in 2008 has made it exceptionally difficult for college graduates to find jobs in their field. The upshot is that students take on lower-paying jobs that do not require degrees in order to make ends meet. Even so, that limited income is, in many cases, not enough to pay back their debt.

Below is an infographic that illustrates the point. Click the infographic to see the entirety on the original site.

college isn't cheap


Education vs. Income Level


To help parents and students better understand the value of higher education, Varsity Tutors, a premier one-on-one private tutoring and test prep provider, today released an infographic that delves into the perceived importance and actual effects of higher education on income and career prospects. Entitled “Education vs. Income Level,” the infographic compares educational attainment to U.S. employment and salary statistics.

education vs income level
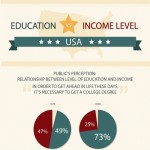
In 2009, 73 percent of Americans said they agreed with the statement, “In order to get ahead these days, it’s necessary to get a college degree,” compared to just 49 percent in 1978. This increasingly common perception aligns with employment and salary statistics for college-educated adults.

“Data has shown that highly educated individuals are more likely to earn higher wages throughout their lives,” said Varsity Tutors founder and CEO Chuck Cohn. “It’s important for parents and students to understand the value of a college degree when making decisions about their education and future career plans.”

The infographic features survey data from the U.S. Bureau of Labor Statistics and other sources, including these key facts:

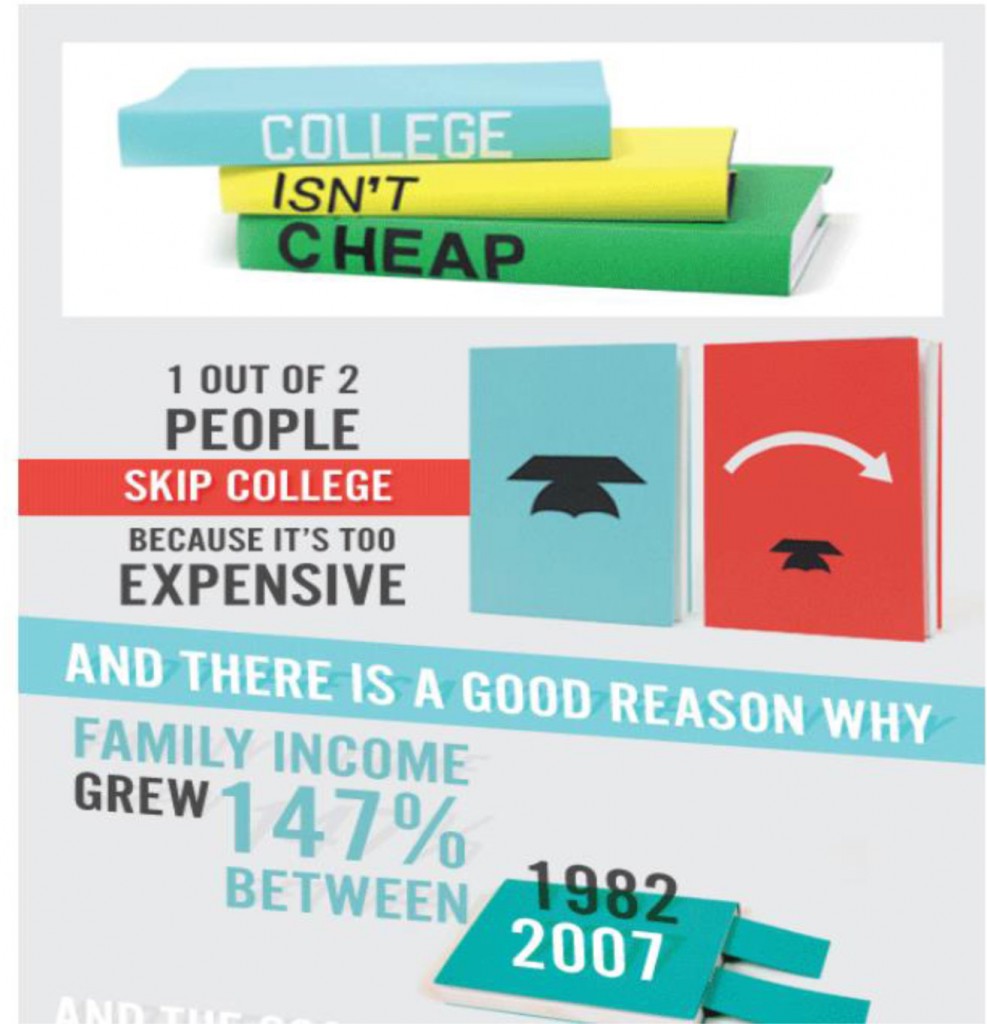
  • The unemployment rate for college graduates is well below the national average, and has been consistently lower than the rates of unemployment for individuals without a Bachelor’s degree over the past 10 years.
  • In 2013, the unemployment rate for people with a Bachelor’s degree or greater was 3.7 percent, compared to 7 percent for those with some college experience or an Associate’s degree, 8.1 percent for those with a high school diploma, and 12 percent for those with less than a high school diploma.
  • Individuals with a Bachelor’s degree are expected to earn $2.422 million over the course of their lives, compared to just $1.371 million for those with only a high school diploma.

The infographic also highlights differences in income among individuals with master’s and doctoral degrees, and compares wages and annual earnings across several career fields from Engineering to Social Sciences. To learn more about the impact of higher education on income, view the full infographic athttp://www.varsitytutors.com/blog/education+vs+income+level+in+the+usa+infographic.


For more information about Varsity Tutors and its services, visit www.varsitytutors.com.


About Varsity Tutors


Varsity Tutors is a premier private academic tutoring and test prep provider designed to help students at all levels of education achieve academic excellence. Varsity Tutors delivers in-home, personalized, one-on-one instruction in any subject from STEM to the humanities and customized preparation for all standardized exams, including ISEE, SSAT, SAT, ACT and graduate exams such as the GRE, LSAT, MCAT and GMAT. Students from elementary to graduate school are expertly matched with an exceptional tutor who is best able to address their unique needs and goals. To ensure satisfaction and safety, only the highest caliber tutors are selected to join Varsity Tutors following a rigorous screening process. Varsity Tutors currently serves 19 cities nationwide and offers a variety of tutoring packages. Students and their families interested in learning more about Varsity Tutors should visit varsitytutors.com


A Dropout Nation


The U.S. is often considered a dropout nation. Graduating from high school is important for many reasons, including higher employment rates and taxable incomes for graduates. However, while high school graduation rates in the U.S. are rising, there’s much improvement to be made – especially among disadvantaged students. Have a look at the state-by-state comparison of graduation rates broken down by race, along with recommendations on how to improve these rates.

A Dropout Nation